
Over the last years companies are placing big bets on data analytics and the value it creates is indisputable. However, working with data requires an array of skills to avoid misinterpretations and wrong conclusions. This blog uncovers the most common mistakes when working with data.
In today’s data-driven economy, it is not only a competitive advantage to own data, but rather work with data. With the rise of dashboards in board and meeting rooms analytical competency and critical thinking are getting more important than ever. You have to “speak data” to gain reliable insights out of your data and to critically question what is being presented to you. Nothing is worse than relying your decisions on wrong data or misinterpretations. To avoid the most common pitfalls of data analysis, here some practical tips for you:
1. Clean Data
Before you start to analyze, it is vital to understand your data and where it comes from. Check if your data set is complete, ensure a consistent format and get rid of errors and redundancies. If your data is gathered from several sources, make sure to normalize your data and double-check if the merge or consolidation of the different data sources is valid. Data is the skeleton of every analysis you do. As the saying goes „Garbage in, Garbage out“, it is crucial to invest enough time in the input of your analysis.

2. Statistical validity
Another tricky mistake to be avoided is the so called “Sampling Bias”. You draw conclusions or derive actions based on data which is sampled and not representative. For example: You test a call-to-action button (green vs. red) on a website with 1 million users. Taking decisions based on a sample group of 30 users might lead to wrong conclusions as you are relying on random data. Poor tests or low data validity can lead to wrong interpretations and you don’t want to base your decisions on coincidences.
3. Correlation & Causation
The perennial favourite that correlation doesn’t imply causation is a far-too-common mistake in data analysis. Whereas correlation only describes how strongly a pair of variables are linearly related, causation indicates that one variable is impacting the other variable. Here a helpful video to keep the correlation/causation fallacy in mind.
4. Context
“Context is King Baby” – a quote by the famous Google Digital Marketing Evangelist Avinash Kaushik. And he’s right. Numbers, Metrics or KPIs without any context are barely valuable. Let’s have a look at this dashboard from Google Analytics:
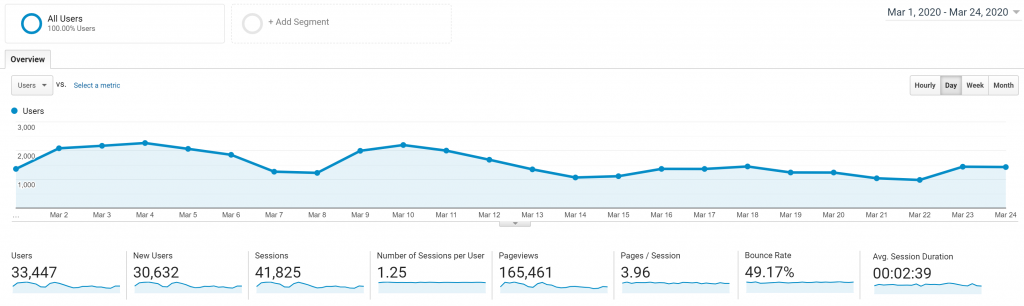
We have data about website visits and the behaviour of the visitor in a given time period. But what does this dashboard tell us? It basically shows numbers without any context and makes it pretty hard to draw conclusions. This example illustrates the importance of adding context to your data (for example by adding a comparable time period or benchmark). Find more examples how you can add context to your data here.
5. Critical thinking
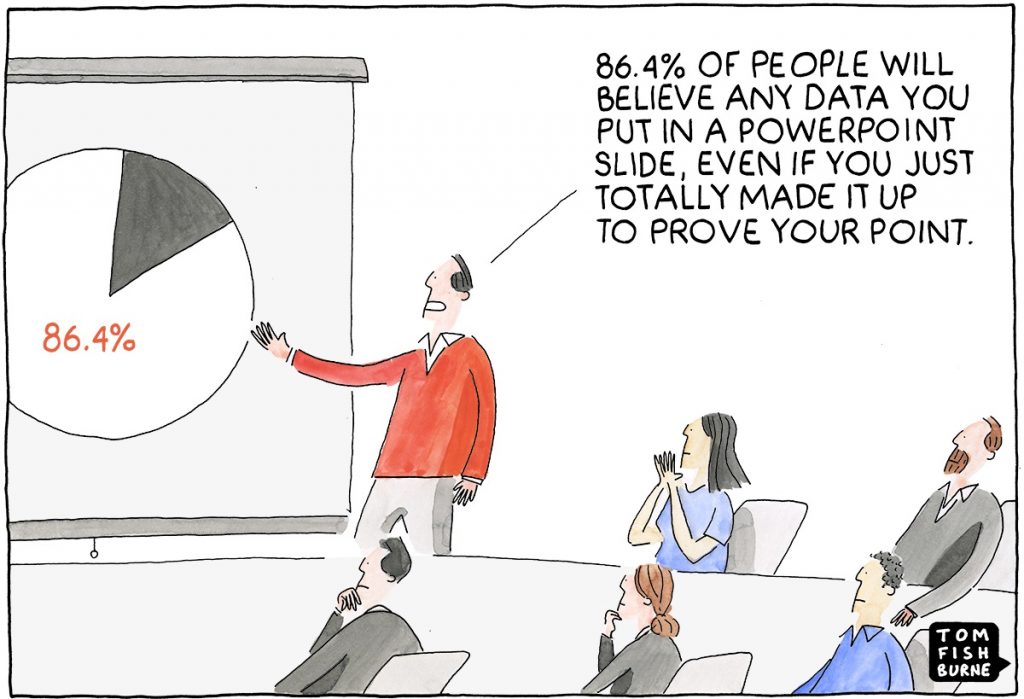
Last but not least, keep in mind that data and dashboards can be tweaked to support a specific message. There are different methods to “window-dress” a dashboard such as the smart use of visual elements or the selection of a favourable time period. Keep a critical eye, ask the right questions and be aware of the different stakeholders and their interest to avoid “data brainwash”.
Gratuliere zu deinem sehr spannenden Blog! Hoffe er sensibilisiert möglichst viele Menschen Daten sinnvoll und mit gesundem Menschenverstand zu interpretieren.
Felix
Hi Felix, vielen lieben Dank für deinen Kommentar. Das hoffe ich auch, Daten- und Analysekompetenz ist heute mehr gefragt denn je.
Clarissa