Business Intelligence has tremendous impact on the organizational decision making. There are many studies related to the commercial part of the businesses such as product and sales management describing best practices how to use the digital tools to enable growth of the business in terms of expanding the market share or having an impact on yields. Contrary to that, there are just a few of studies in regards to the quality part of the business. Why?
Business Intelligence brought entirely new perspective into identifying sales opportunities, tailoring products for specific customer groups needs or driving efficiency. This has been very holistically described Chris Lukasiak in the Forbes magazine. It had and has sensational influence on how organisations do things, how companies change their structures, value propositions and how every person involved in the particular firm understands that data driven decisions become as equal important as based on the qualitative methods.
Why isn’t there focus on quality topics?
As the graph below presents, operational excellence has landed on the 3rd last place among the organisational disciplines using the business intelligence and on the 2nd place never applying it: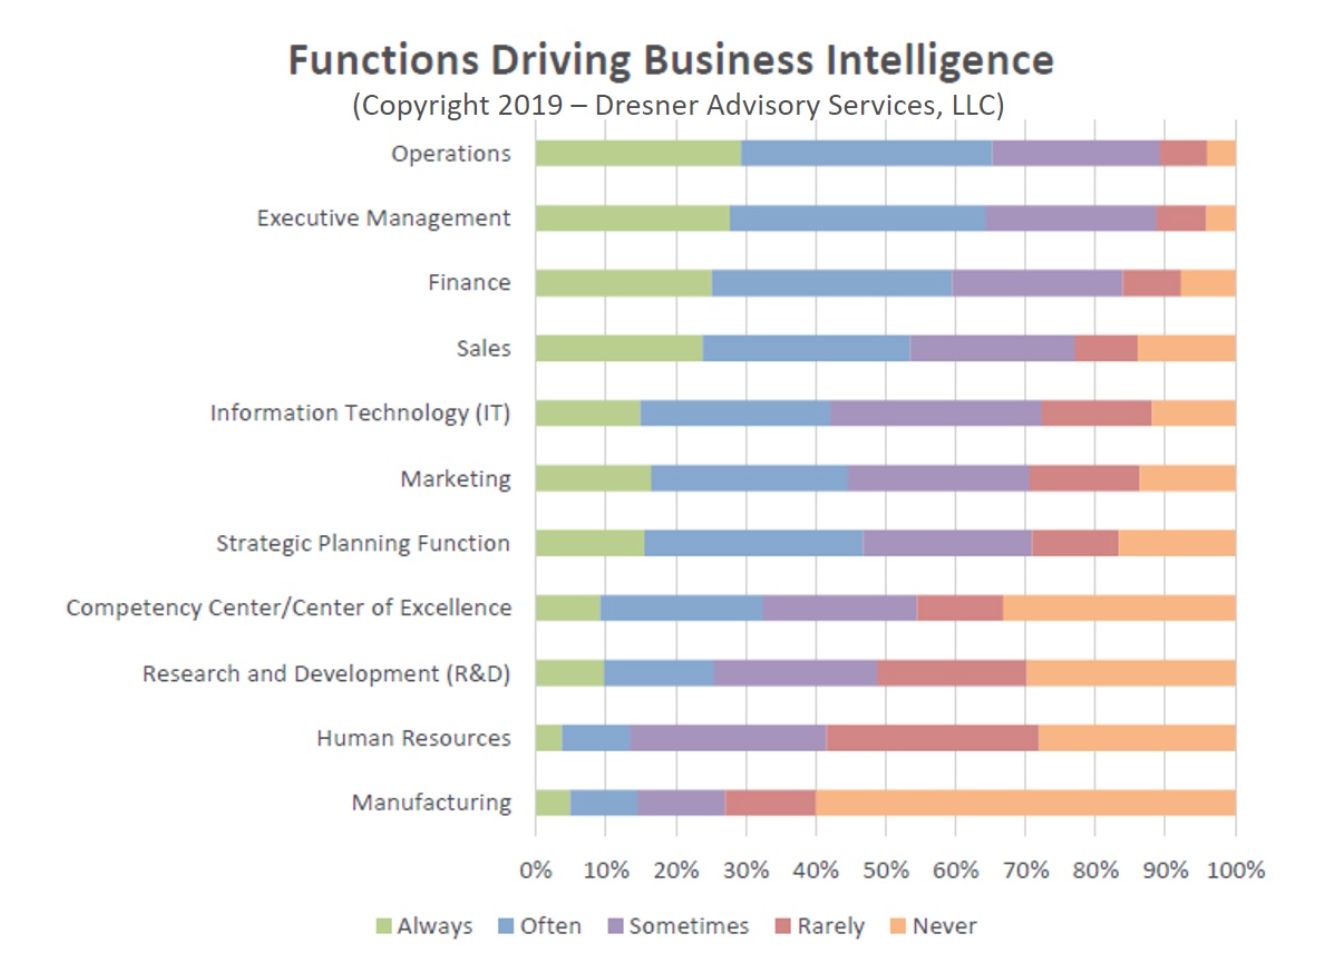
Functions driving Business Intelligence (source: https://cloudcomputing-news.net/news/2019/jun/17/what-matters-most-in-business-intelligence-2019/)
Only this chart can indicate some conclusions:
- The more commercial oriented function, the more business intelligence is involved
- If manufacturing applications would go along the way with center of excellence, the more efficient processes and quality would be achieved
Maybe finding the alliances within other functions can boost quality management?
There are two major observations which could give us better understanding of the situation:
- Silos oriented companies cannot fully exploit the business intelligence and innovation capabilities
- Metrics and dimensions around one function usually do not go along with another functions
Alright – how can we change it and counterattack?
For the stakeholder management, the best sources to take some benchmark is TV series „The Office“:
Scene from The Office (source: https://indianexpress.com/article/entertainment/television/top-10-the-office-episodes-6397126/)
For the second observation, it seems to me that really quick wins can be tooltip function in the apps such as PowerBI:
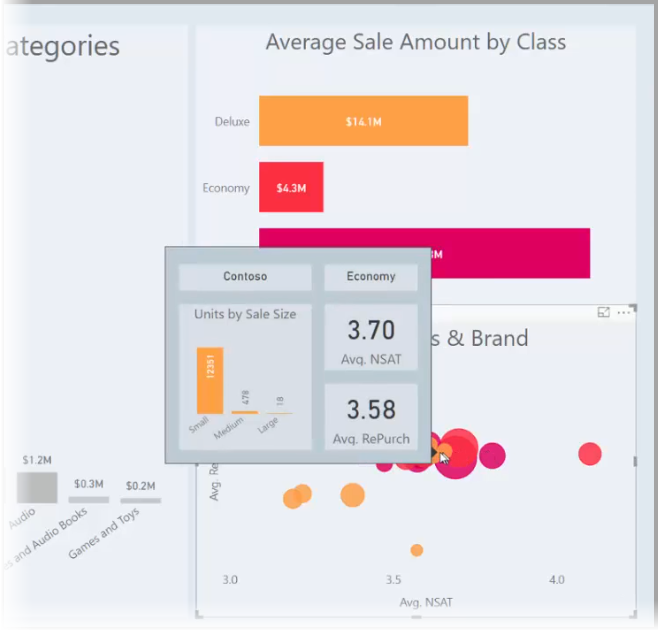
Tooltip in PowerBI (source: https://docs.microsoft.com/en-us/power-bi/create-reports/desktop-tooltips)
It gives the possibility to see different perspectives on one dashboard and charts do not have to be fully connected with in the metrics way, but just on the abstract level.
Further option, can be using Pearson correlation coefficient function which is available in tools such as PowerBI, Tableau (for data visualisation using quick measures) or to be computed and modelled in R or Python. It gives the perspective which part of the performance are related to each other.