
Between 50-80% of corporate business intelligence (BI) projects fail according to various studies. [1] In a time where data-driven decision making becomes a key success factor in competition, the Business Intelligence Canvas can add serious value with increasing the chances for a successful BI project.
Communication is Key
In BI projects, usually a high degree of cross-collaboration between IT and business stakeholders is required. That means deep technical knowledge teams up with deep business knowledge in order to design, develop and implement the desired solution.
Moreover, the precise project target and delivery is often unclear until or even past the mid stage of such a venture. Either because the business simply does not know yet what exactly it needs. Or it is unclear for both sides whether the desired solution is even feasible given constraints on e.g. data availability, budget, resources and so on.
It becomes apparent that communication between IT and the business is a key success factor in such projects.
The Business Intelligence Canvas
The canvas methodology origins from the Business Model Canvas initially proposed by Alexander Osterwalder and has since then been applied to a variety of other complex subjects. In general, the BI Canvas breaks a BI system down into its main components on a single page. The canvas is to be read from left to right, i.e. from data sources to the frontend application in line with how BI solutions are set up from a workflow perspective.
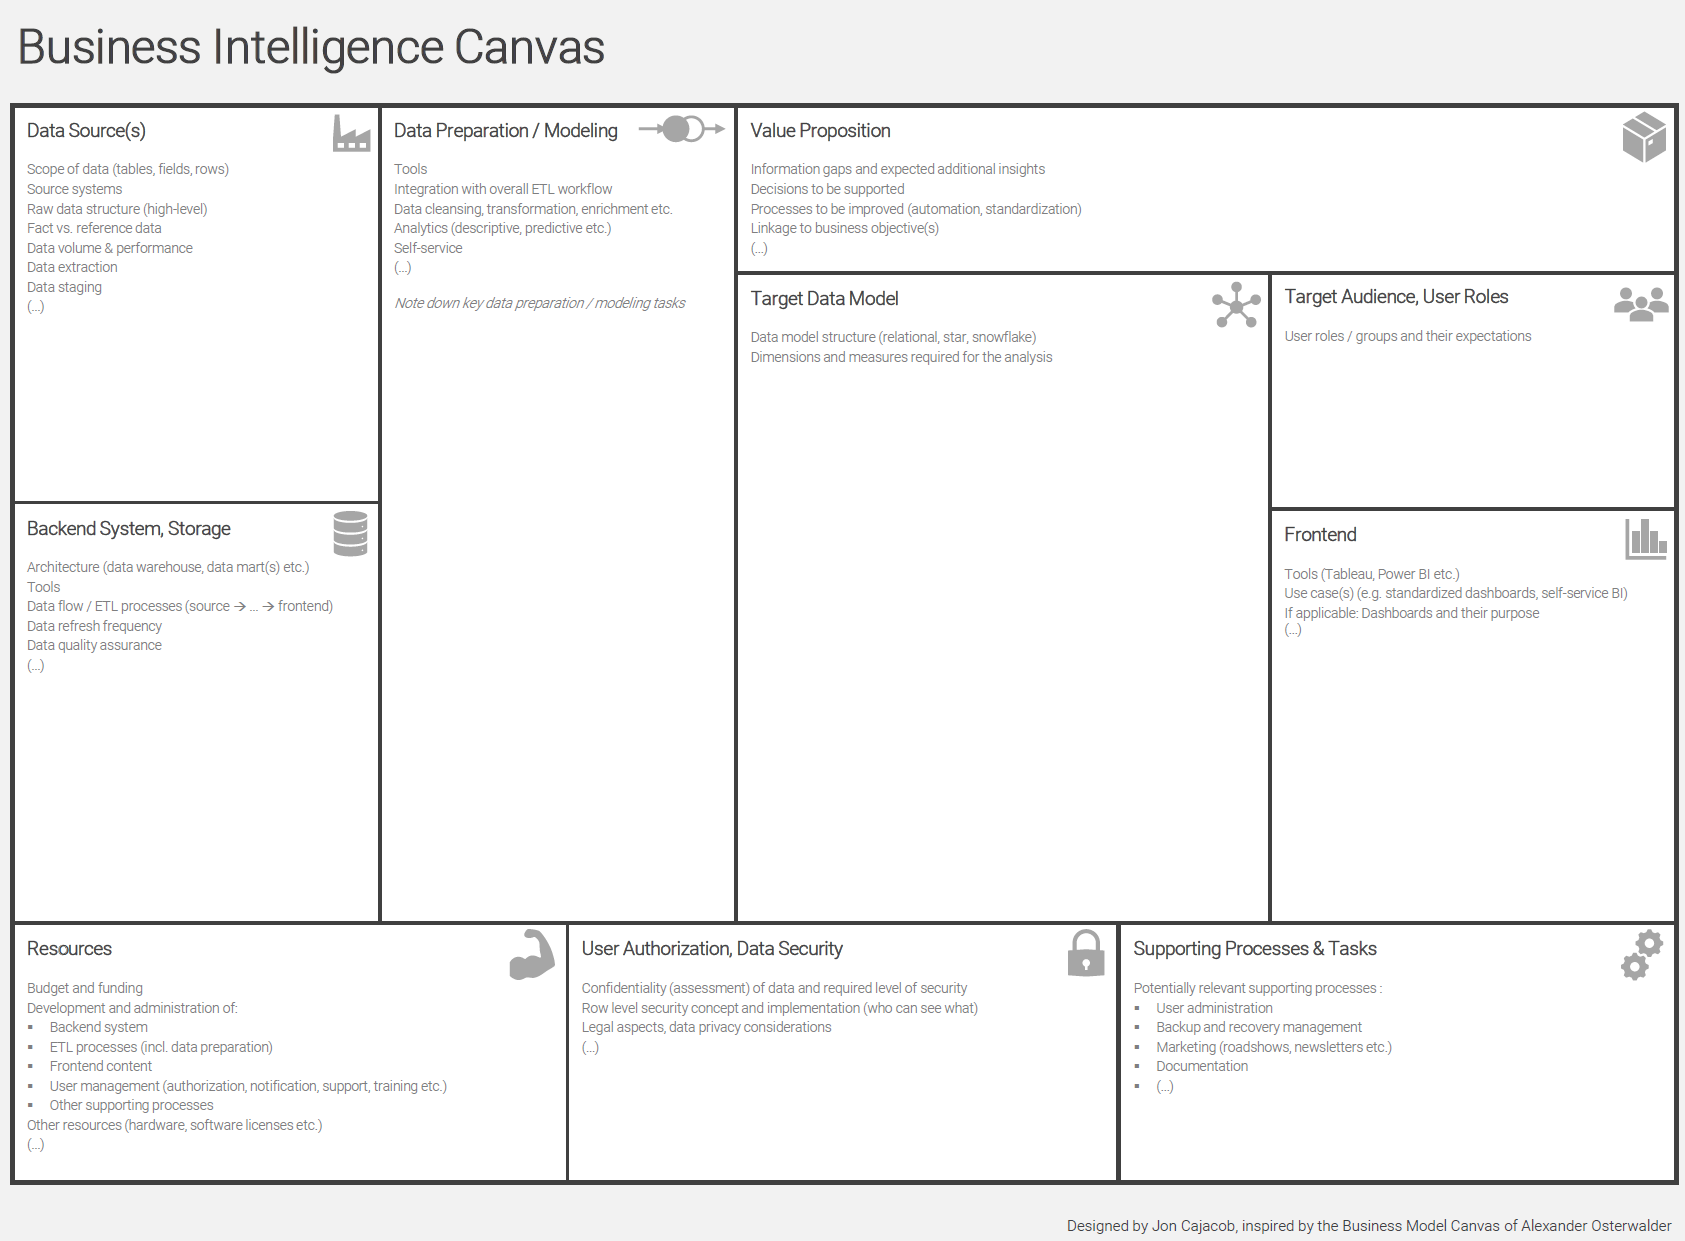
Download the canvas as a PDF here.
Each box on the canvas contains keywords that help to formulate and address questions necessary to design each individual component and integrate it with the others:
- Value Proposition: What are the incremental insights we aim to get from using the new system and how do they support decision making?
- Data Sources: What is the scope of data and where do we get it from?
- Backend System, Storage: Is it required to have a storage / backend system (e.g. data warehouse, data mart(s) etc.) to manage the data between the source and where it is used?
- Data Preparation / Modeling: Does the data need to be cleaned, transformed, enriched etc. in order to prepare it for the analysis?
- Target Data Model: Which dimensions and measures are required for the analysis?
- Target Audience, User Roles: Who is doing what with the data and what are their requirements?
- Frontend: Is a BI frontend tool required and for what purpose shall it be used? (e.g. standardized dashboards for large group of users, self-service BI for small group of analysts etc.)
- Resources, Data Access Control, Supporting Processes & Tasks: What supporting processes / tasks are required to operate the new system?
The canvas can be printed and used in workshops to discuss and sketch the design of a new BI system and derive requirements accordingly. Likewise, it could also be used to analyze an existing system in order to understand problem areas and identify potential improvements. Breaking down a BI system into its components enables to manage the usually high complexity better. And most important, being used as a mutual communication platform, the canvas will enable an improved collaboration between IT and the business and thus result in more effective solutions.
Jon Cajacob is leading several business intelligence projects on the intersection of IT and the business in Siemens Schweiz AG and blogs from the CAS Business Intelligence & Analytics class.
[1] Meehan, 2011; Legodi & Barry, 2010; Beal, 2005; Laskowski, 2001