Data Visualization Fall 2020

Student Projects

The idea of each project is to apply the visualization principles, students have acquired in the course “Data Visualization”. Students could choose data and task for their project based on their interests. Their task was to develop a meaningful interactive visualization with D3.js.


Yves Baur, Pascal Benz Meat consumption https://infovis.pages.enterpriselab.ch/hs20/g01
Miranda Birrer, Gabriela Moos Reptiles in owl diet https://infovis.pages.enterpriselab.ch/hs20/g02
Marina Novikova, Aaron Schwegler Tödliche Polizeieinsätze in den USA https://infovis.pages.enterpriselab.ch/hs20/g03
Pablo Rüdisüli, Urs Stadelmann What do happy countries do different? https://prudisul.pages.enterpriselab.ch/davi_happiness/
Fabian Küenzle, Vinooshan Thevathas OEE Dashboard 4.0 https://infovis.pages.enterpriselab.ch/hs20/g05/
Dominik Brunner, Matthias Obrist Verkehrsentwicklung während Corona https://infovis.pages.enterpriselab.ch/hs20/g06/
Fabio Stuber, Suriyakanthan Suriya Covid Auswertung https://infovis.pages.enterpriselab.ch/hs20/g07/
Cedric Hildbrand, Manuel Vogel Astronaut Stats https://infovis.pages.enterpriselab.ch/hs20/g08/
Corinne Burch Potenzieller Wohnraum Schweiz https://infovis.pages.enterpriselab.ch/hs20/g09/
Raphael Huber, Christof Kälin World Conflicts https://infovis.pages.enterpriselab.ch/hs20/g10/
Group 11 COVID-19 mortality rate analysis https://infovis.pages.enterpriselab.ch/hs20/g11/

Workshop @Applied Machine Learning Days 2020

organized by Tobias Mérinat und Halldór Janetzko

Overview

Information visualizations are typically used for explorative analyses or result presentations. In both cases, communicating information visually in an appealing and concise manner is often a challenging task, and also one that Engineers and Data Scientists repeatedly struggle with.

However, with some background knowledge on information visualization and a set of guidelines, principles and rules, the task can turn from being difficult and dreadful to interesting and fun.

You will get the theoretical background on what makes up good visualizations, see lots of examples, both of the good and the bad kind, and build our own interactive visualizations of real-world data with the Processing language.

If you always struggle a bit with visually presenting your findings in a meaningful way, highlighting the important parts and leaving out the rest, then this workshop is for you.

Outcome

Participants will know what makes up a good visualization and which visualization methods suits which data type. They will have built their own interactive visualizations with Processing and have gotten a glimpse into the world of visualization with Python.

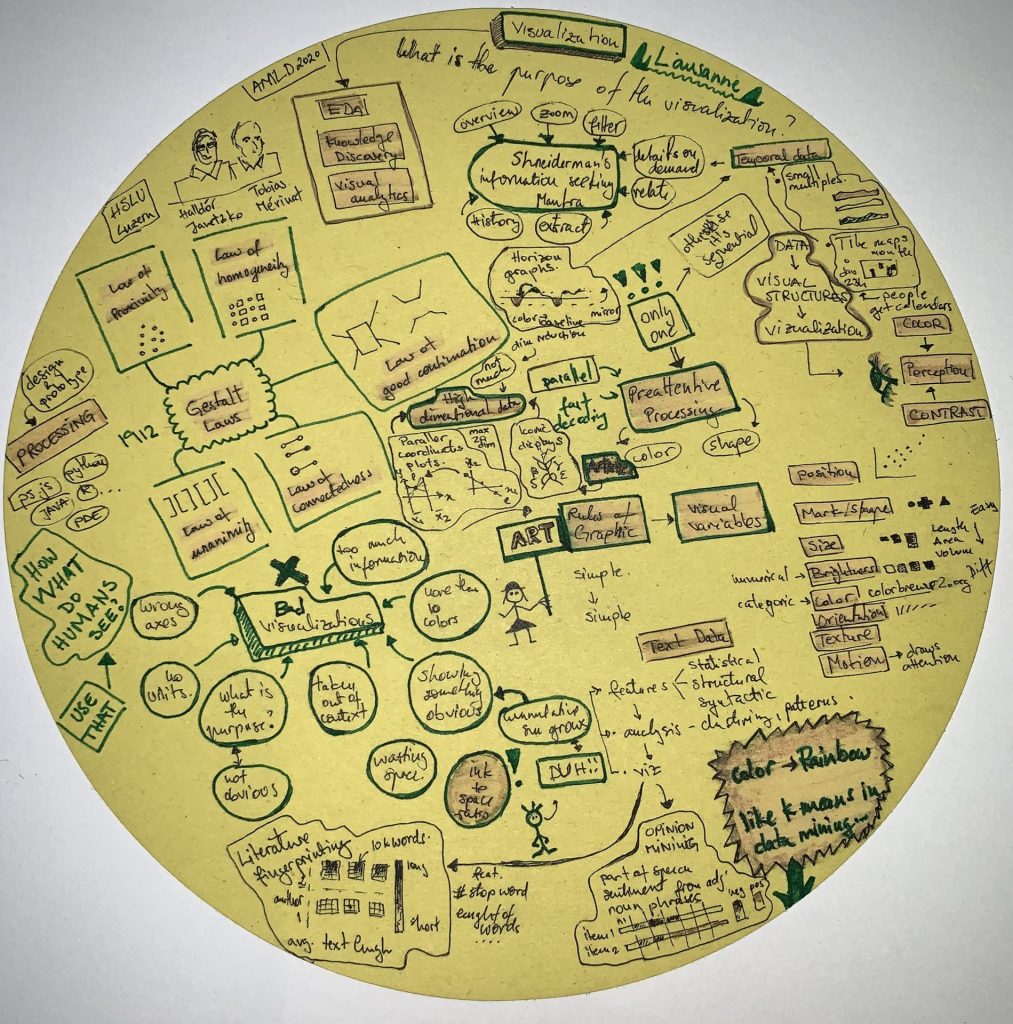
Summary visualization courtesy of participant Tereza Iofciu

Data Visualization Fall 2019

Student Projects

The idea of each project is to apply the visualization principles, students have acquired in the course “Data Visualization”. Students could choose data and task for their project based on their interests. Their task was to develop a meaningful interactive visualization with D3.js.


Deschwanden Samuel, Santaniello Antonio Wealth Correlations https://sdeschwa.pages.enterpriselab.ch/wealth_correlations
Fellmann Rinaldo, Soares Correia Kevin Olympic Games https://ksoaresc.pages.enterpriselab.ch/3d_davi
Ilic Stefan, Ingold Lukas Military Spendings https://lingold.pages.enterpriselab.ch/davi/
Pascal Müller, Muriel Häner Denver Crime https://mhaner.pages.enterpriselab.ch/davicrime/
Becker Maximilian, Schwarzer Philippe Plane Crashes https://mbecker.pages.enterpriselab.ch/davi_flugzeugabstuertze/
Olivia Kaufmann, Sandro Köchli Meteroites https://okaufman.pages.enterpriselab.ch/davihs19-meteorit/
Kesseli Nicolas, Brun Carlo Forest Fires in Brasil https://cbrun.pages.enterpriselab.ch/datenvisualisierung_hs19
Chamas Joun, Bolzer Dario, Zhang Felix Smart Building https://jchamas.pages.enterpriselab.ch/d3-smartbuilding/
Bucher Jan, Grepper Joel Speed Camaras https://bucher.cloud/davi/
Schwendimann Thomas, Cardozo Raphael Mental Health https://tschwend.pages.enterpriselab.ch/davi/
Michael Zimmermann, Samuel Fröhlich HSLU Module Overview https://davi-19.pages.enterpriselab.ch/hslumodulevisualizer/
Fenk David, Hösli Tobias Vacant Housing https://dfenk.pages.enterpriselab.ch/visualization_vacanthousingspace_ch/
Bucher Patrick, Christen Stefan Source Folder Analysis https://skiapoden.github.io/
Schär Tobias, Gomes Machado Rafael FIFA 19 Player Analysis https://davi-hs19.pages.enterpriselab.ch/davi-projekt_gruppe-9/
Palkoska Marco, Luthiger Yannick WIFI Security https://eddex.github.io/WiFi/
Patrice Weber, Sophie Matter Swiss Emigration https://smatter.pages.enterpriselab.ch/ch-emigration/